
Exporting student attendance to calculate count of days late or other attendance types
Mengekspor data dari Prestia
Pertama, kita perlu mengekspor data kehadiran dari Prestia sebagai CSV. Ikuti langkah-langkah di bawah ini.
- Buka Administration > Attendance > Export Attendance .
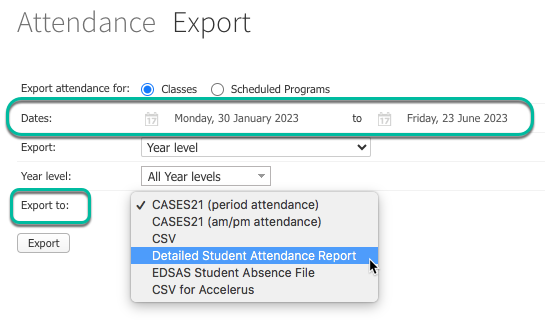
- Pilih rentang tanggal yang Anda inginkan, lalu pilih Detailed Student Attendance Report dari daftar dropdown seperti yang ditunjukkan:
- Klik tombol Export .
- Ini akan mengekspor file CSV yang dapat Anda buka di Excel.
Membuat Pivot Table Anda di Excel
Buka file CSV Anda dari langkah-langkah sebelumnya, lalu ikuti langkah-langkah ini untuk membuat laporan Anda:
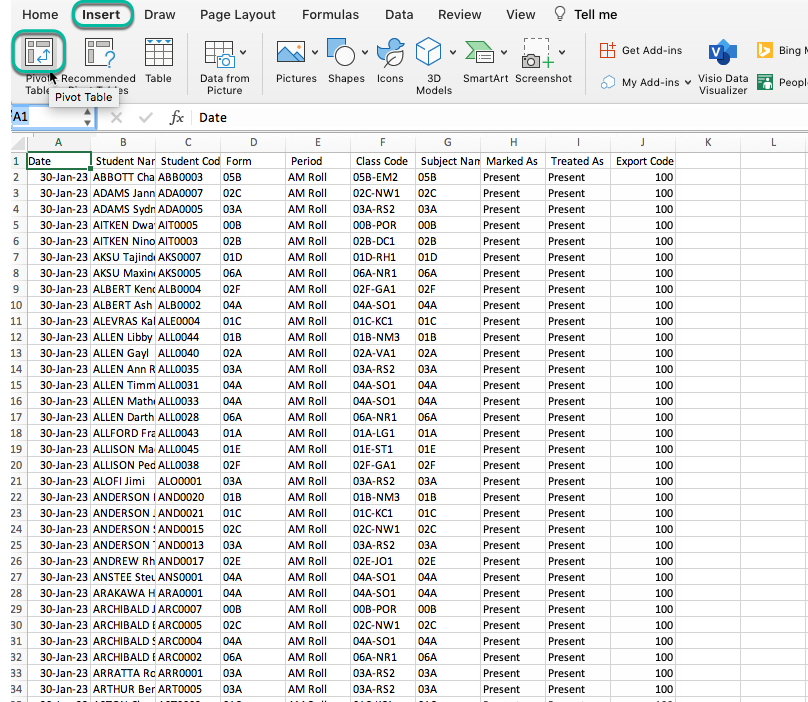
- Di Excel, buka Insert > Pivot Table .
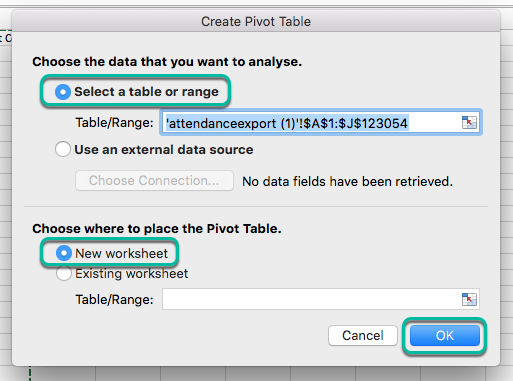
- Biarkan rentang tetap seperti yang dipilih secara default, pastikan New worksheet dipilih untuk lokasi Pivot Table, lalu klik OK .
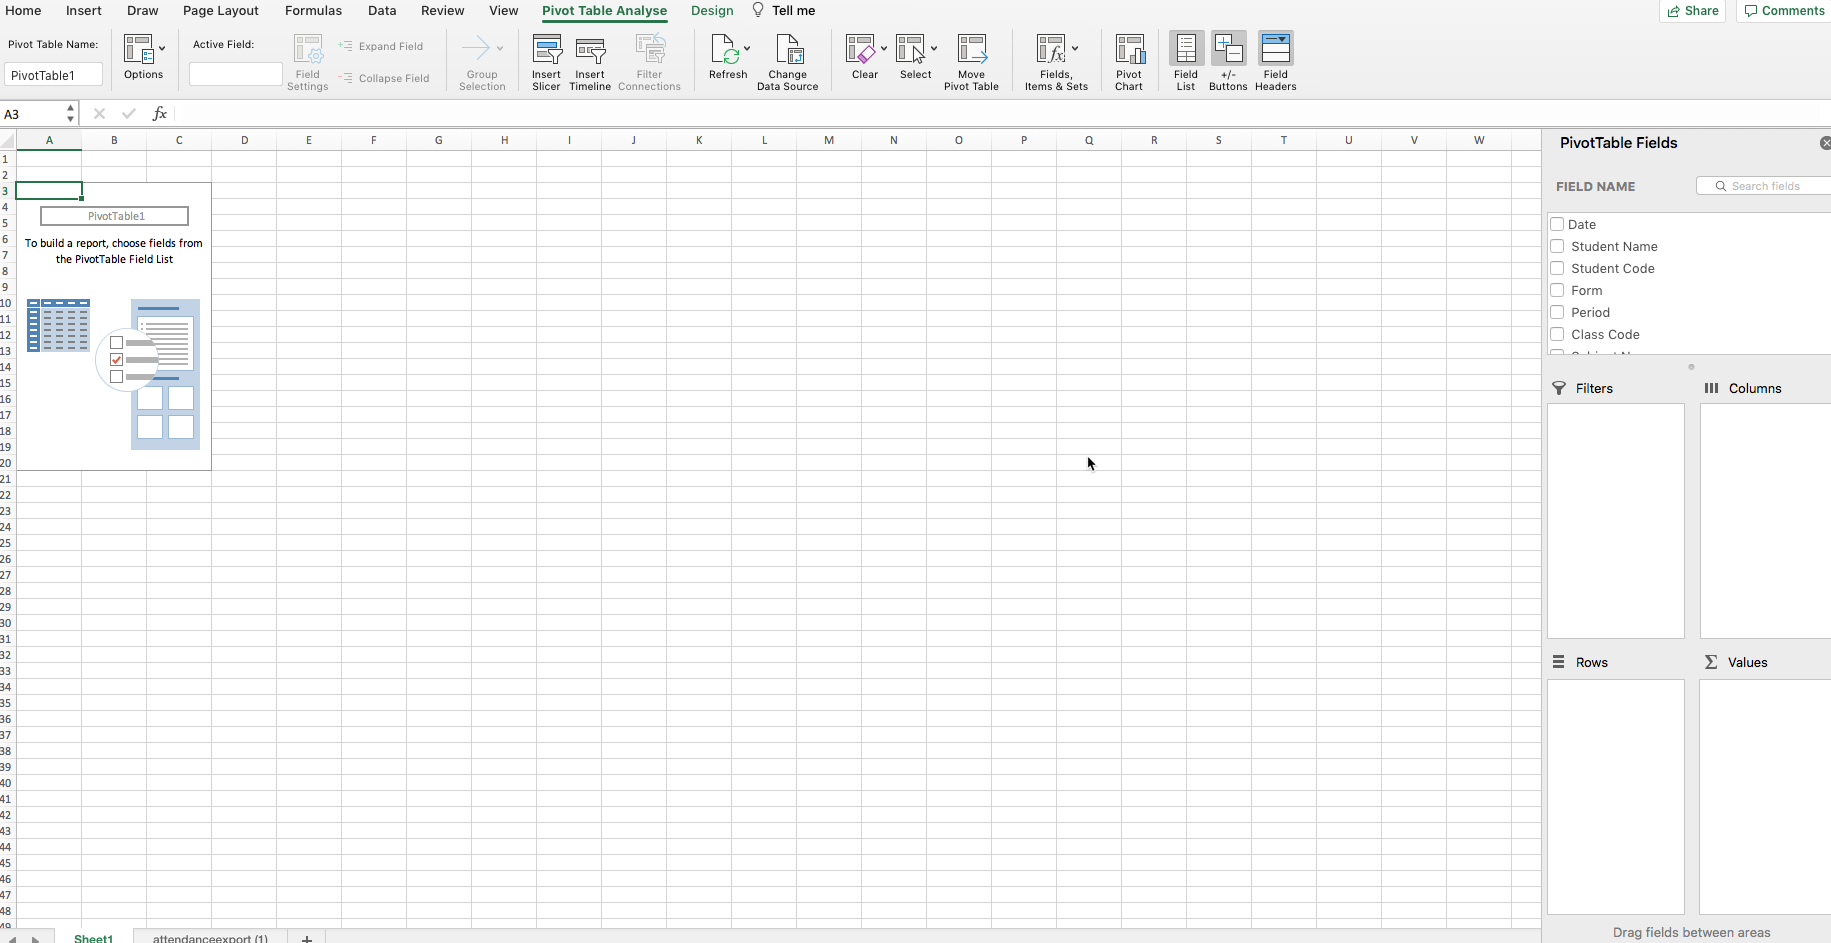
- Pivot Table akan dibuat di lembar baru:
Menggunakan Pivot Table untuk membuat laporan
Selanjutnya, kita perlu membuat laporan. Lakukan pilihan di Excel sebagai berikut:
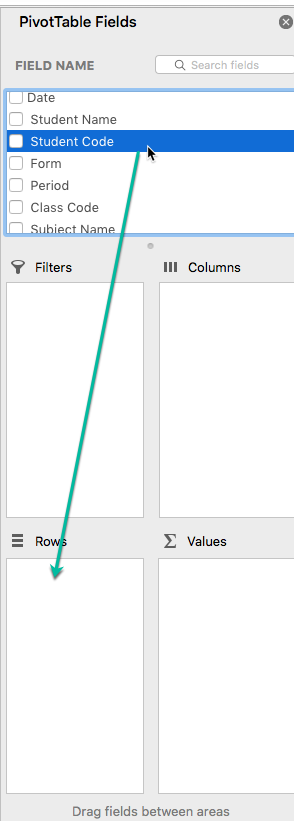
- Di area PivotTable Fields di sisi kanan halaman, pilih bidang Student Code untuk baris dengan menyeretnya ke area Rows .
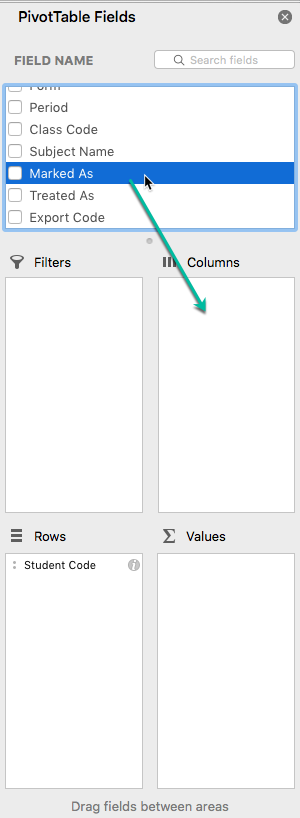
- Pilih bidang Marked As dan seret ke area Columns .
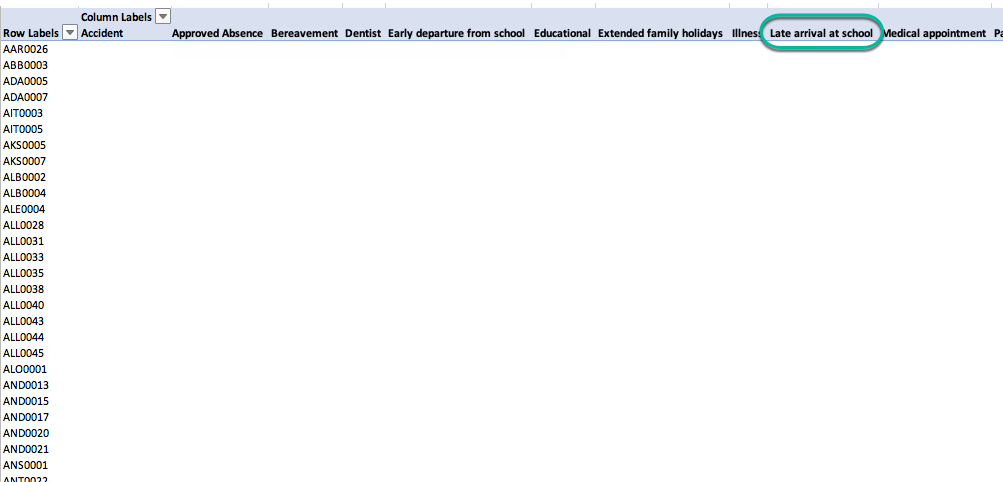
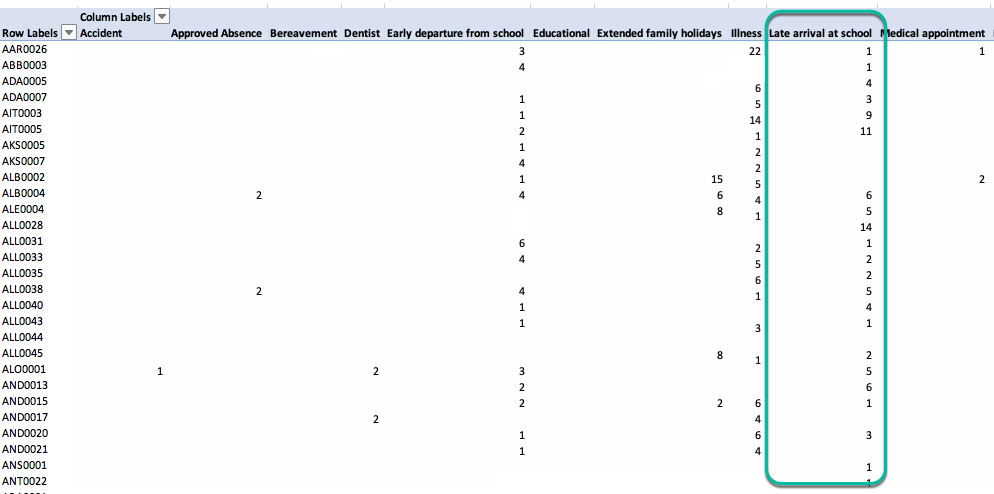
- Anda akan melihat bahwa ini telah membuat kolom untuk setiap jenis kehadiran, termasuk satu untuk kedatangan terlambat, seperti yang ditunjukkan di bawah ini:
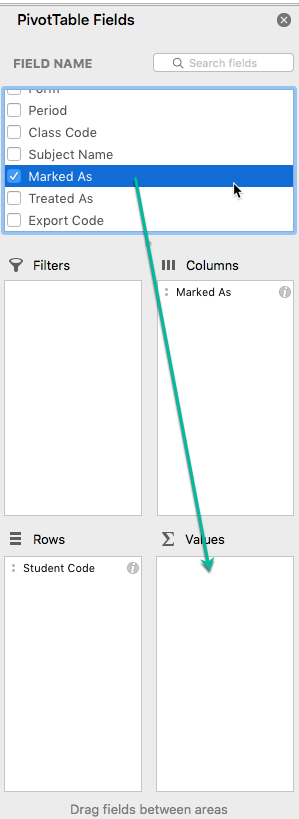
- Seret bidang Marked As ke area Values .
- Anda akan melihat bahwa sebuah hitungan ditampilkan untuk setiap siswa untuk jumlah periode yang ditandai sebagai Late arrival at school . Anda dapat cukup yakin bahwa hitungan ini sama dengan jumlah hari keterlambatan untuk setiap siswa, karena sekolah umumnya hanya menggunakan jenis kehadiran ini sekali per hari, selama pencatatan kehadiran periode pertama.
Perhatikan bahwa kehati-hatian diperlukan saat menafsirkan laporan yang dibuat di atas. Beberapa jenis kehadiran akan menunjukkan hitungan yang tidak mewakili jumlah hari yang ditandai oleh jenis ini. Misalnya, jika seorang siswa ditandai tidak hadir karena Family Holiday, dan sekolah memiliki 2 periode per hari, hitungan akan menunjukkan dua kali lipat dari jumlah hari siswa ditandai dengan alasan ini.
Hitungan selalu mewakili jumlah periode yang ditandai dengan jenis kehadiran.
Exporting the data from Prestia
First, we need to export attendance data from Prestia as a CSV. Follow the steps below.
- Go to Administration > Attendance > Export Attendance .
- Select your required date range, then select Detailed Student Attendance Report from the dropdown list as shown:
- Click the Export button.
- This will export a CSV file that you can open in Excel.
Creating your Pivot Table in Excel
Open your CSV file from the previous steps, and then follow these steps to create your report:
- In Excel, go to Insert > Pivot Table .
- Leave the range as selected by default, make sure New worksheet is selected for the Pivot Table location, then click OK .
- The Pivot Table will be created in a new sheet:
Using the Pivot Table to create the report
Next, we need to build the report. Make the selections in Excel as follows:
- In the PivotTable Fields area on the right of the page, select the field Student Code for the rows by dragging it into the Rows area.
- Select the Marked As field and drag it to the Columns area.
- You will see that this has created a column for each attendance type, including one for late arrivals, as shown below:
- Drag the Marked As field into the Values area.
- You will see that a count is shown against each student for the number of periods marked as Late arrival at school . You can be reasonably confident that this count equates to the number of days late for each student, as schools generally only use this attendance type once per day, during the first period’s roll marking.
Note that caution is required when interpreting the report created above. Some attendance types will show a count that is not representative of the number of days marked by this type. For example, if a student has been marked away for a Family Holiday, and the school has 2 periods per day, the count will show as double the number of days the student was marked with this reason.
The count always represents the number of periods marked with the attendance type.